Earth Science worksheet
    Topic: Dewpoint
    Dewpoint
    Base your answers to questions 1 on the photographs below and on your knowledge of Earth science. One photograph shows a digital device that recorded several weather variables. The second photograph shows two weather instruments, labeled A and B.

    reference-tables, pressure, meteorology, weather-variables, standard-1-math-and-science-inquery, velocity-slope-sediment-size-channel-shape-stream-valume-distance-from-the-sun-gravitational-force-period-of-revolution-speed-of-revolution, standard-1-math-and-science-inquery, changing-length-of-a-shadow-based-on-the-motion-of-the-sun fig: esci82019-examw_g13.png

    1

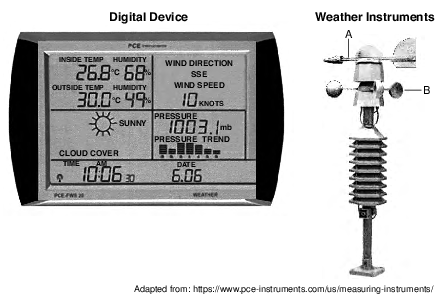
    Based on the outside air temperature and relative humidity shown on the digital device, what is the approximate dewpoint for the time shown on the device?

    (1) 8°C

    (2) 12°C

    (3) 18°C

    (4) 31°C

    2

    The station model below shows several weather variables recorded at a particular location.

    reference-tables, key-to-weather-map-symbols, reference-tables, dewpoint, meteorology, presentation-of-weather-data, meteorology, weather-variables, meteorology, dewpoint-humidty-cloud-formation, standard-6-interconnectedness, models fig: esci62013-examw_g2.png

    What was the most likely dewpoint at this location?

    (1) 32°F

    (2) 40°F

    (3) 61°F

    (4) 70°F

    3

    What is the dewpoint when the dry-bulb temperature is 8°C and the wet-bulb temperature is 2°C?

    (1) 28°C

    (2) 6°C

    (3) 3°C

    (4) −9°C

    Base your answers to questions 4 on the weather map below and on your knowledge of Earth science. On the weather map, the location of the center of a high-pressure system (H) and a front are shown. Isobar values are labeled in millibars (mb). Weather station models represent the weather conditions at Atlanta, Georgia, and Tampa, Florida.

    reference-tables, key-to-weather-map-symbols, meteorology, presentation-of-weather-data, standard-1-math-and-science-inquery, changing-length-of-a-shadow-based-on-the-motion-of-the-sun, standard-6-interconnectedness, models fig: esci12018-examw_g53.png

    4

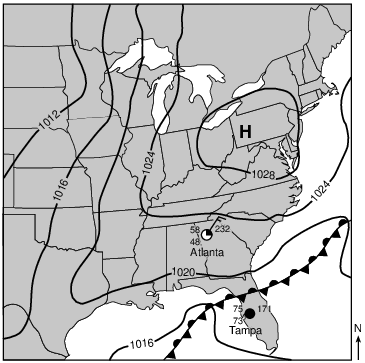
    Describe one piece of evidence shown on the map that indicates that Tampa, Florida, has a high probability of precipitation. [1]

    Allow 1 credit. Acceptable responses include, but are not limited to:

    • — The dewpoint and air temperature are close together./high relative humidity

    • — 100% cloud cover/overcast

    • — Tampa is close to a front.

    • — The air pressure is low.

    Base your answers to questions 5 on the diagram below and on your knowledge of Earth science. The diagram represents a weather balloon as it rises from Earth’s surface to 1000 meters (m). The air temperature and wet-bulb temperature values in degrees Celsius (°C) and the air pressure values in millibars (mb) are given for three altitudes.

    meteorology, measuring-weather-variables, standard-6-interconnectedness, models fig: esci82016-examw_g38.png

    5

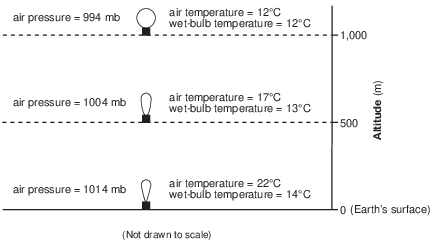
    Determine the dewpoint and the relative humidity of the air at Earth’s surface. [1]

    Dewpoint: ______________°C Relative humidity: ________%

    Allow 1 credit if both dewpoint and relative humidity are correct.

    • Dewpoint: 8°C

    • Relative humidity: 40%